
Plan–Do–Check–Act (PDCA) is a cycle for learning whether a change addresses a problem. An A3 report records the problem, evidence, trial and decision on one page so the team and coach can review the reasoning together. See the Lean Enterprise Institute A3 guide.
Run one PDCA cycle
- Plan. Use Pareto to choose the loss and RCA to test the suspected cause. Set the baseline, target and measures that must be protected.
- Do. Name an owner, trial scope and review date. Record what changed and any departures from the plan.
- Check. Compare the result with the target using the same denominator and comparable conditions. Check side effects and variation by shift.
- Act. Build a verified change into standard work, revise the trial or stop it. Agree who will check whether the gain holds.
Manufacturing case study · Filler jams
Owner: Line lead · Worked example with guiding figures
Plan · Show the current situation
The Pareto case recorded 180 jam minutes over 10 shifts. Assume 100 scheduled filling hours, giving 18 minutes per 10 hours. RCA points to missing format-specific guide settings. Predict that a controlled setup and clearance check will halve the rate.
Current-state process flow
- Change bottle format
- Set guide from generic instruction
- Restart → bottles catch at infeed
Improvement opportunity. Specify and verify guide clearance by format.

Do · Implement the improvement actions
Trial the approved format settings and clearance check across 10 comparable shifts. Record jam minutes, scheduled hours, changeover duration and first-pass quality.
| Owner and task | Before trial | During trial | Final trial shift |
|---|---|---|---|
| Line lead · Confirm scope and approved settings | Active | — | — |
| Operator · Run the clearance check and log losses | — | Active | Active |
| Line lead + Quality · Compile trial evidence | — | — | Active |
Check · Measure effectiveness
The trial records 72 jam minutes over 100 hours. The rate is down 60% and meets the target. Example guardrail results show unchanged first-pass quality and average changeover duration.
Effectiveness. Jam rate fell 60%, from 18 to 7.2 minutes per 10 scheduled hours. The target was 9 or less. First-pass quality and average changeover duration held in the worked trial.
| What to verify | Evidence to review |
|---|---|
| Setup sheet matches bottle format and revision. | Compare the sheet used with the controlled copy. |
| Clearance check is performed and recorded. | Observe a changeover and sample the reading and sign-off. |
| Quality and changeover duration remain stable. | Compare first-pass results and duration with comparable shifts. |
Act · Standardise or improve further
Adopt the checks for the trial format, update the controlled standard and brief all shifts. Review the jam rate after two weeks and reopen the A3 if the gain does not hold.
Standardisation example. Add the approved gap, check point and sign-off to the controlled changeover sheet.
Next improvement opportunity. If jams recur with clearance in range, compare events by format and shift.
| When / status | Owner | Action | Evidence or decision |
|---|---|---|---|
| Day 0 · Adopted | Line lead | Approve the verified check for the trial format. | Record the decision and scope. |
| Next shift · Planned | Line lead | Update the controlled setup sheet and brief all shifts. | Check the revision and briefing record. |
| Week 2 · Due | Line lead | Review jam minutes per 10 scheduled filling hours. | Reopen the A3 if the rate exceeds 9 or quality worsens. |
Mining case study · Queues at the ROM stockpile tip
Owner: Haulage supervisor · Worked example with guiding figures
Plan · Show the current situation
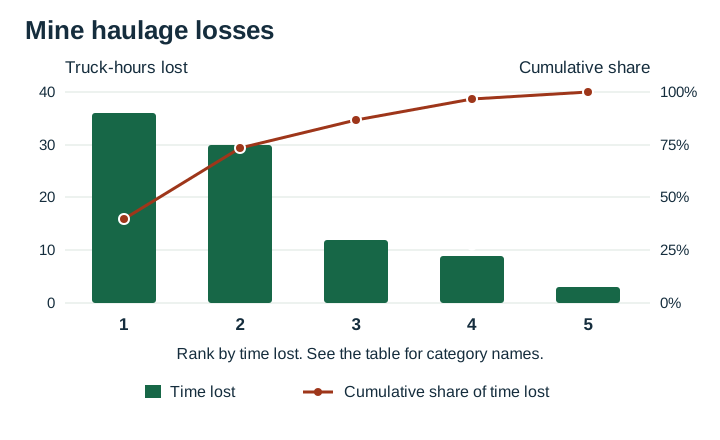
The baseline was 36 truck-hours of waiting. Assume 180 loads, or 12 minutes per load. RCA identified bunching after reopening. Predict that confirming the destination status and intake restriction promptly will reduce waiting.
Current-state process flow
- ROM stockpile tip reopens
- Modular assigns trucks using destination status
- Arrivals bunch → queue at tip
Improvement opportunity. Verify conflicting status so Modular uses the confirmed operating condition.
Do · Implement the improvement actions
Pilot the approved exception-response routine at the ROM stockpile tip. Modular handles routine dispatch. The Control Room Operator verifies conflicting status, escalates under site procedures and logs outcomes.
| Owner and task | Before trial | During trial | Final trial shift |
|---|---|---|---|
| Haulage supervisor · Agree pilot boundary and rules | Active | — | — |
| Control Room Operator · Verify and log exceptions | — | Active | Active |
| Haulage supervisor · Compile queue and service data | — | — | Active |
Check · Measure effectiveness
The pilot records 22.5 truck-hours across 180 loads, or 7.5 minutes per load. The target is met. Compare loading waits, delivered tonnes and plant feed interruptions before recommending adoption.
Effectiveness. Queue time fell 37.5%, from 12 to 7.5 minutes per completed load. The target was 8 or less. Review loading waits, plant feed interruptions and delivered tonnes before adopting.
| What to verify | Evidence to review |
|---|---|
| Modular handles routine assignments. | Compare dispatch records with the approved pilot scope. |
| Status conflicts are verified and escalated. | Sample exception logs for confirmation, action and ownership. |
| The queue does not move elsewhere. | Compare loading waits, plant feed interruptions and delivered tonnes. |
Act · Standardise or improve further
If the guardrails support adoption, update the control room standard and brief the field teams. The haulage supervisor reviews the next comparable week before extending the trial.
Standardisation example. If the safeguards hold, add status verification, escalation and handover to the control room standard.
Next improvement opportunity. If waiting shifts to loading or plant feed deteriorates, map that handoff and test a change.
| When / status | Owner | Action | Evidence or decision |
|---|---|---|---|
| Day 0 · Target met | Haulage supervisor | Review loading waits, delivered tonnes and plant feed. | Record the adoption decision after the checks. |
| Next shift · Conditional | Control Room Supervisor | If adopted, update the exception routine and brief both teams. | Confirm the controlled revision and handover. |
| Next comparable week · Due | Haulage supervisor | Review queue minutes per load and the effects on other stages. | Extend only if the rate stays at 8 or less and the checks hold. |
Review the A3 with the people doing the work
Ask what supports the cause, what the trial changed and what evidence would change the decision. Record the next decision and review date. Both cases use guiding figures and sample outcomes.