

Case-study basis. This anonymised case draws on the professional mining improvement experience behind LuRea. It uses a reconstructed engineering scenario with explicit assumptions; modelled opportunities are not verified realised client results.
Executive summary
Could an open-pit mine close its production gap with its existing fleet? The review considers two drill rigs, four excavators and 24 haul trucks against a required production rate of 1,370 tonnes of total rock per scheduled hour.
The starting model identifies drilling as the constraint. Reviewing the flow of work exposes opportunities in bench readiness, shift handover, drill relocation and fragmentation quality. Under the proposed assumptions, integrated capacity rises from 731 to 1,410 equivalent t/h, approximately 93%, and the constraint moves downstream to crushing.
LuRea’s approach combines the DMAIC improvement cycle—Define, Measure, Analyse, Improve and Control—with Theory of Constraints and engineering capacity modelling. Value stream mapping and waste walks help identify where work is interrupted and translate those findings into targeted improvements.
The business challenge
Available loading and hauling equipment does not guarantee that a mine can achieve its production plan. If insufficient material is prepared upstream, downstream assets can wait while the business considers buying more equipment.
The objective is to identify the limiting activity, test the productive potential of the existing fleet and establish what the whole operation can support before committing to additional fleet investment.
Understanding the operation
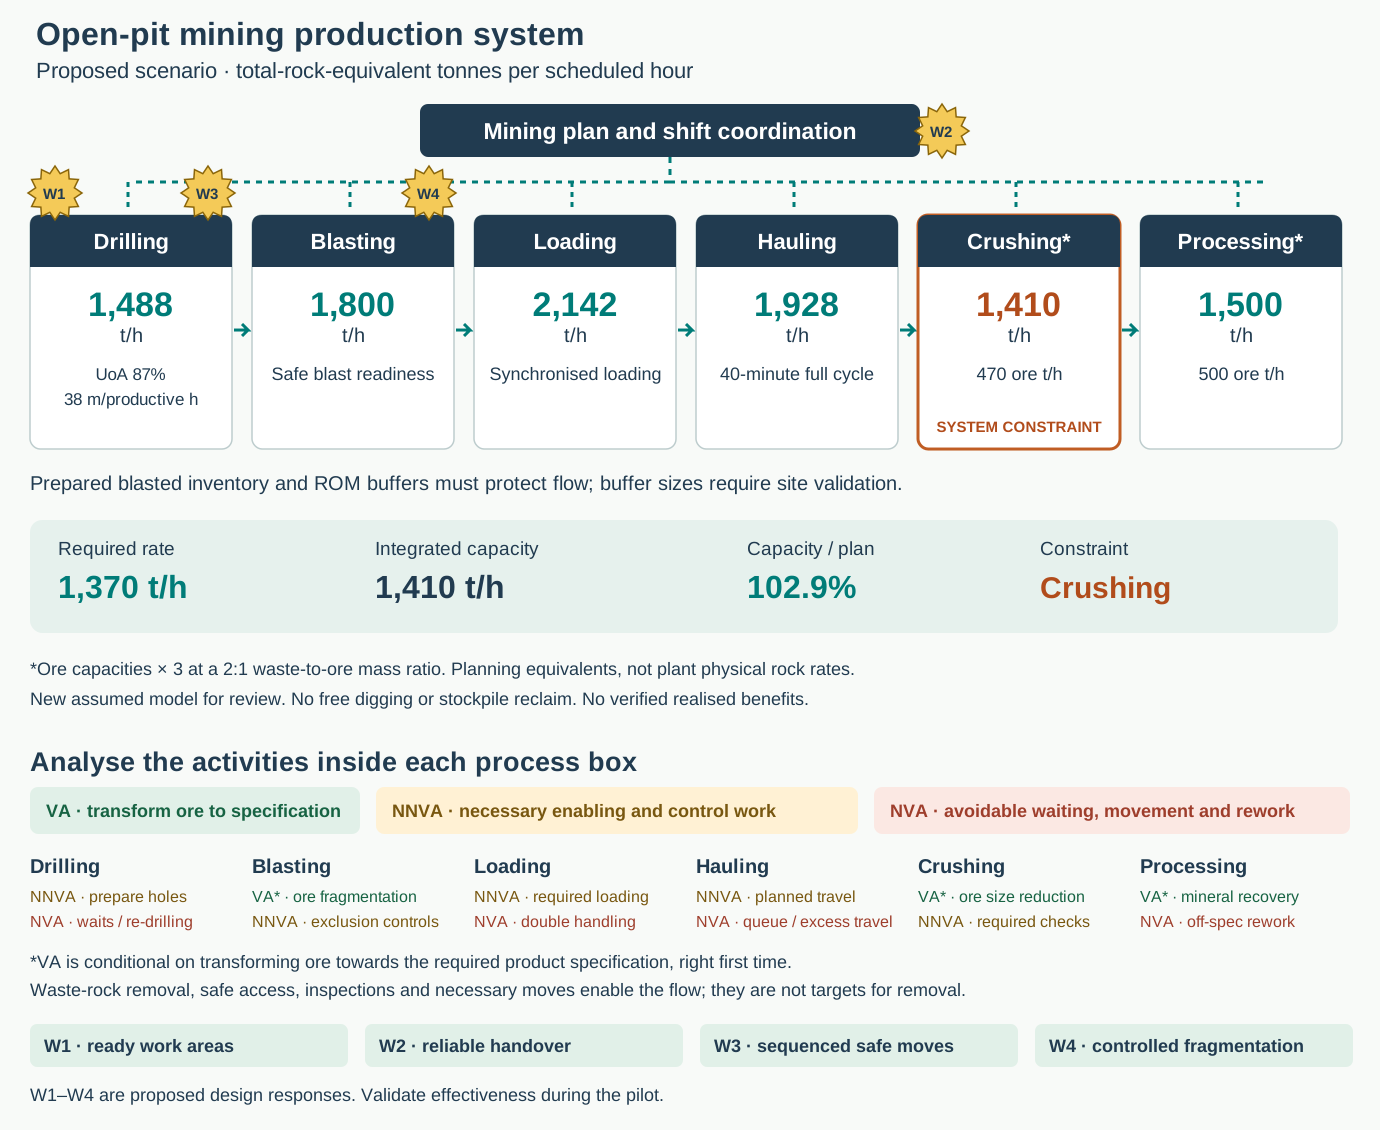
The current-state review follows material and information from drilling and blasting through loading, hauling, crushing and processing. Process capacities are compared on a common time and material basis. In this scenario, drilling supplies only 731 t/h; adding loading or hauling capacity first would leave that constraint in place.
The map also looks inside each process. Transforming ore towards the required product specification can add value. Necessary enabling work includes drilling preparation, planned transport and required inspections. Avoidable waiting, extra movements and rework consume resources without advancing the product.

Identifying improvement opportunities
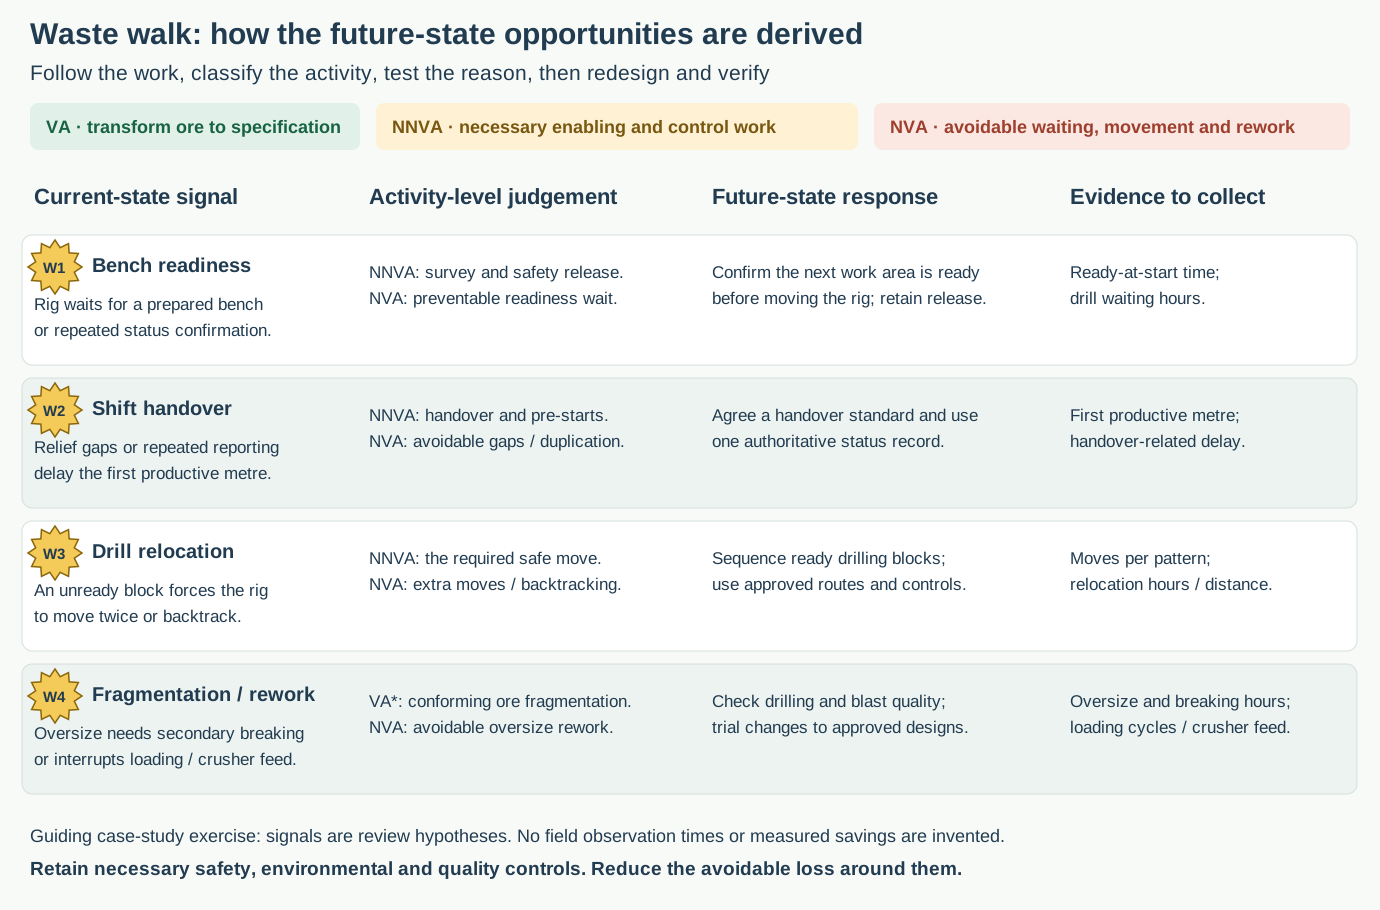
A waste walk connects the map to the work performed in the pit. Following the sequence with operators, checking event records and reviewing handovers reveals where the flow is interrupted. The W1–W4 markers show the reasoning behind the proposed improvements in this reconstructed case:
- Bench readiness: a rig waiting for an unprepared area points to coordinating survey, preparation and work-area release before the rig moves.
- Shift handover: relief gaps or repeated status reporting point to a reliable handover routine and one authoritative operational record.
- Drill relocation: double moves and backtracking point to sequencing ready blocks and using approved routes.
- Fragmentation: oversize and secondary breaking point to checking drill-and-blast quality and its effect on loading and crusher feed.
The distinction matters: the necessary inspection or safe relocation remains; the preventable wait or extra move is challenged. Necessary waste-rock removal is also different from Lean waste. The process is reviewed activity by activity, rather than labelling an entire machine or department as value-adding or wasteful.
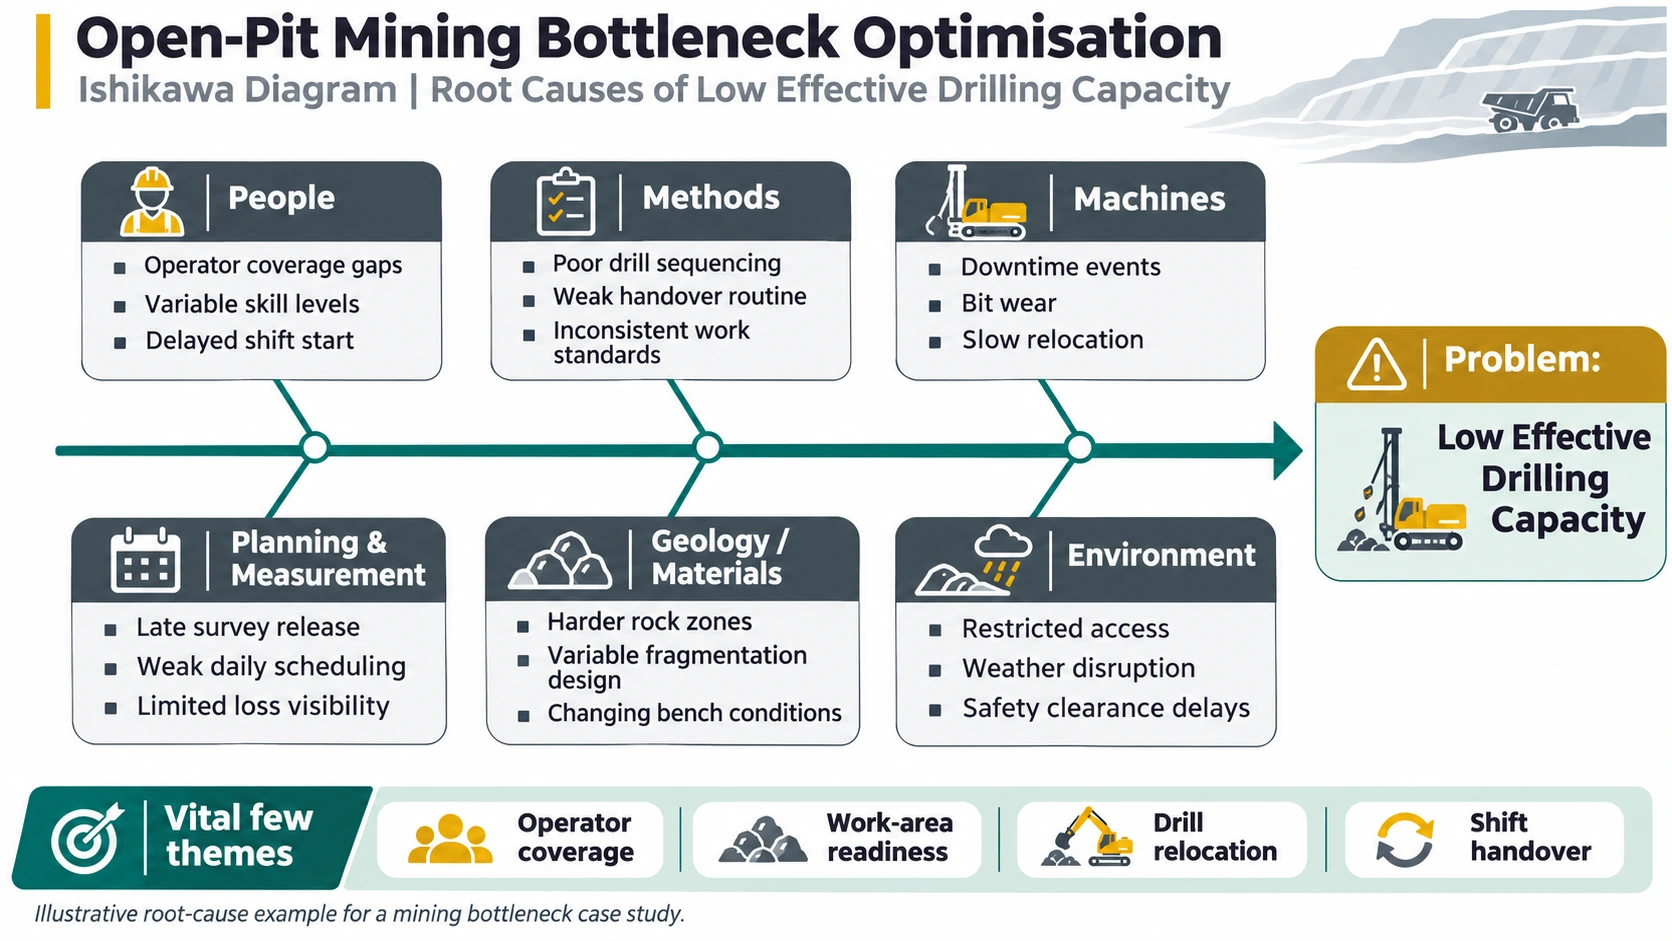
Ishikawa analysis supports investigation of possible causes, while a Pareto helps prioritise losses. The waste walk supplies the operational context for those analyses. The examples are hypotheses to verify on site, not measured field findings.
Designing the future state
The proposed operating model protects drilling with ready work areas, dependable operator coverage, planned relocation and coordinated blasting. Existing dispatch systems continue to coordinate equipment and destinations, with exception handling under approved site procedures.
The engineering scenario tests drill utilisation increasing from 65% to 87%, together with productive penetration increasing from 25 to 38 m/h. That penetration increase is a substantial assumption requiring technical trials. Recovering waiting time alone does not establish it.
With those assumptions, drilling supports about 1,488 t/h. Crushing then limits the integrated plan to 470 ore t/h, equivalent to 1,410 total-rock t/h at the assumed 2:1 waste-to-ore mass ratio. The future state therefore identifies the next constraint instead of treating improved drilling output as an unlimited production gain.

Implementation and sustainability
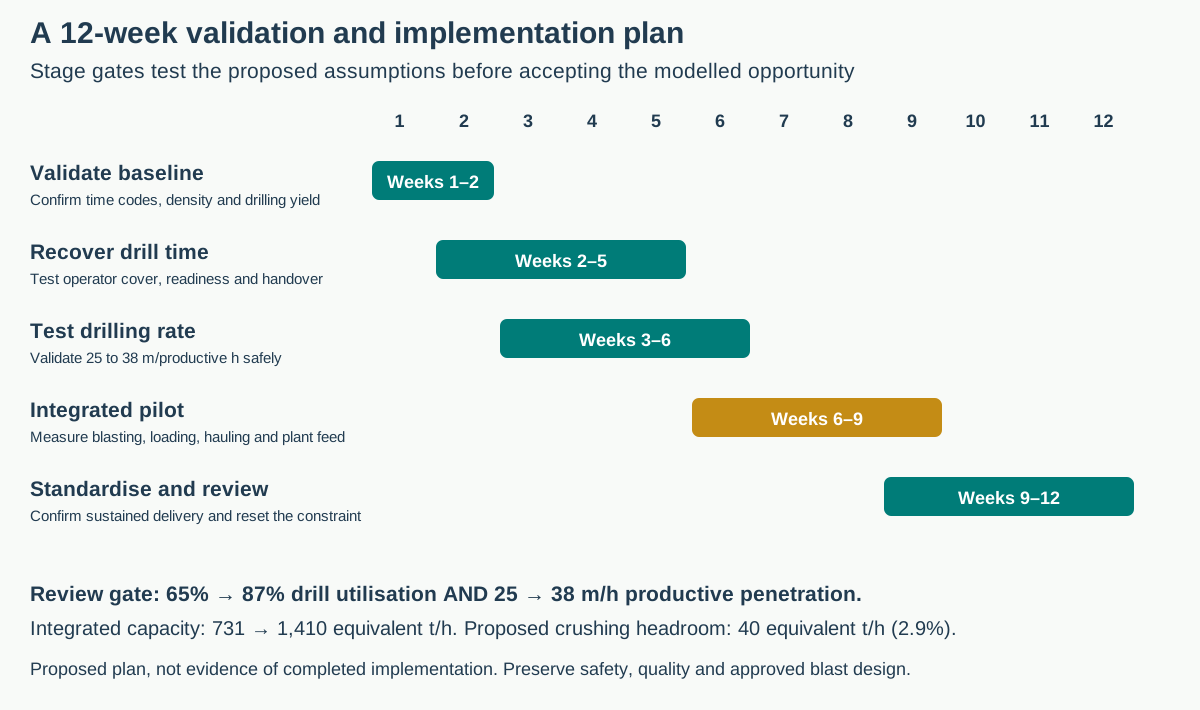
The proposed 12-week approach validates the baseline, tests the priority changes and runs an integrated operating pilot before standardising the new routines. Responsibilities span mine planning, drilling supervision, maintenance, dispatch and downstream operations.
Daily reviews would track productive drilling time, readiness and handover delays, relocation, fragmentation, buffers and plant acceptance. The proposed system has only 2.9% capacity above plan. Representative shift data and variability analysis are needed to establish reliable delivery; this review model does not claim a completed pilot, capability study or simulation.
Business value
The scenario indicates an opportunity to improve capacity with the same initial fleet and make a better-informed investment decision. It also shows why mining throughput, ore feed and saleable output must be distinguished.
Potential production and capital-deferral benefits depend on sustainable performance, ore availability, grade, recovery, operating costs and downstream acceptance. A financial evaluation would value the deliverable incremental output after improvement costs. No realised saving or revenue gain is claimed here.
The LuRea perspective
LuRea’s integrated approach connects the business requirement, the flow of work and the engineering capacity of the operation. The result is a focused set of improvements with a clear explanation of why they matter and how their effectiveness should be tested.
Before investing in additional capacity, establish the productive potential of the existing operation.
Explore the technical analysis or discuss your operational challenge.
Explore the technical analysis
Supporting exhibits and assumptions for readers who want to examine the method. These retain the same review model used in the main case study.
Waste-walk observation and verification
Record the activity, location, start and finish times, quantity, required control and reason for interruption. Keep equipment cycle time, material waiting and end-to-end lead time separate. The exercise below links each signal to a proposed response and verification measure; it does not invent observed times or a VA percentage.
Baseline capacity balance

Root-cause hypotheses
The cause-and-effect diagram structures questions for investigation. Confirm causal relationships through observation, records and trials.
Prioritising the modelled losses
The model provides 1,296 available drill-fleet hours per 30-day month. At 65% productive utilisation, 453.6 hours are not spent drilling. The guiding Pareto allocates this time using the supplied profile’s proportions. It is not an observed dispatch report. Reaching 87% requires recovering 285.1 fleet hours; utilisation improvement alone raises drilling capacity to about 979 t/h.

Assumptions and calculation basis
Review the equipment assumptions and equations
Fleet counts, the required rate and the drill utilisation settings are retained from the supplied scenario. Other numerical drivers are newly selected review assumptions. These are not site measurements or verified industry benchmarks.
| Driver | Unit | Baseline | Proposed |
|---|---|---|---|
| Required total rock rate | t/scheduled h | 1,370 | 1,370 |
| Scheduled hours per shift | h | 12 | 12 |
| Days in review month | days | 30 | 30 |
| Scheduled hours per day | h/day | 24 | 24 |
| Waste-to-ore ratio by mass | t waste/t ore | 2 | 2 |
| Material requiring drilling | fraction | 100% | 100% |
| Drill fleet | rigs | 2 | 2 |
| Drill mechanical availability | fraction | 90% | 90% |
| Drill effective utilisation | fraction | 65% | 87% |
| Productive penetration rate | m/productive h | 25 | 38 |
| Drilling yield | BCM/m | 10 | 10 |
| In-situ density | t/BCM | 2.5 | 2.5 |
| Loading fleet | excavators | 4 | 4 |
| Loading availability | fraction | 90% | 90% |
| Loading effective utilisation | fraction | 60% | 70% |
| Productive loading rate | t/productive h | 800 | 850 |
| Hauling fleet | trucks | 24 | 24 |
| Truck availability | fraction | 85% | 85% |
| Truck cycle utilisation | fraction | 60% | 70% |
| Effective payload | t/load | 90 | 90 |
| Complete haul cycle | min/cycle | 45 | 40 |
| Blasting supply capacity | total rock t/h | 1,800 | 1,800 |
| Crushing effective ore capacity | ore t/h | 470 | 470 |
| Processing effective ore capacity | ore t/h | 500 | 500 |
Drilling: rigs × availability × effective utilisation × productive penetration × BCM/metre × density. Loading: excavators × availability × effective utilisation × productive loading rate. Hauling: trucks × availability × cycle utilisation × payload × 60 ÷ complete cycle minutes.
Drill effective utilisation means productive drilling time divided by available time. Truck cycle utilisation means time engaged in the full haul cycle divided by available time. The complete truck cycle includes spotting/loading, loaded travel, tipping, empty return and ordinary in-cycle waiting. Do not count those delays again in utilisation. Crushing and processing are already effective ore rates per scheduled hour.
The model assumes a 2:1 waste-to-ore mass ratio, no free-dig material, no stockpile reclaim, no rehandling and no net stockpile change. Multiplying ore rates by three creates planning mix equivalents. It does not mean the plant physically processes waste rock. Validate the material mix and schedule before using this conversion.
Proposed implementation roadmap
Method references: Lean Enterprise Institute: activity categories and ASQ: observing the flow and designing the future state. Mining activity classifications are the explicit interpretation used in this case.
Organizational Excellence Reimagined.